Prometheus Server并不直接服务监控特定的目标,其主要任务负责数据的收集,存储并且对外提供数据查询支持。
因此为了能够能够监控到某些东西,如主机的CPU使用率,我们需要使用到Exporter。
Prometheus周期性的从Exporter暴露的HTTP服务地址(通常是/metrics)拉取监控样本数据。
Exporter可以是一个相对开放的概念,其可以是一个独立运行的程序独立于监控目标以外,也可以是直接内置在监控目标中。
只要能够向Prometheus提供标准格式的监控样本数据即可。
我们用来监控Windows系统的台式机或者服务器需要用到 windows_exporter
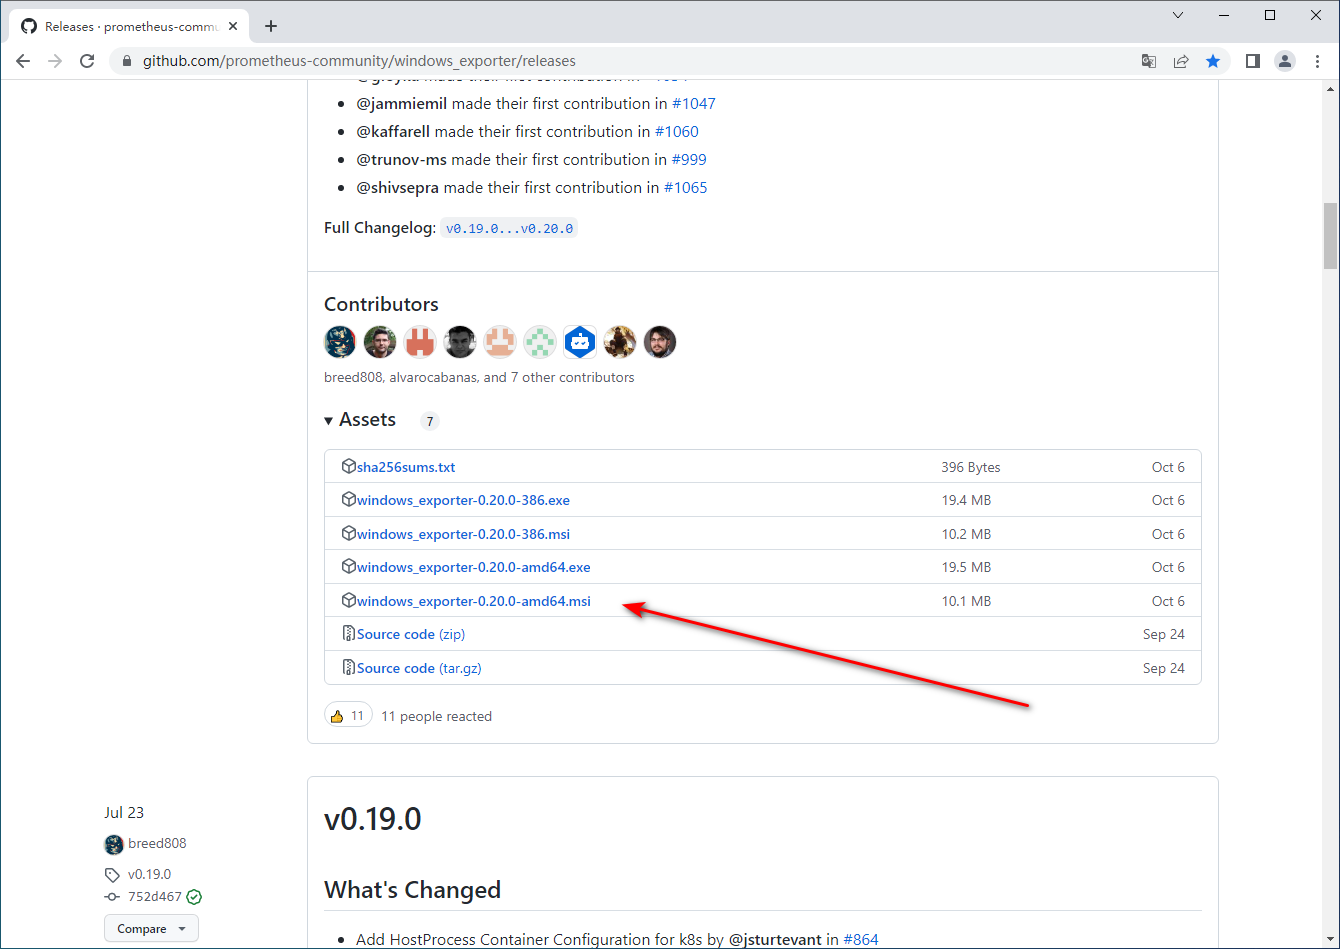
windows_exporter 下载地址 https://github.com/prometheus-community/windows_exporter/releases
大部分主机都是64位操作系统,因此我们下载amd64位的msi(已经封装成msi)
双击下载的 windows_exporter-0.20.0-amd64 直接安装成服务进程
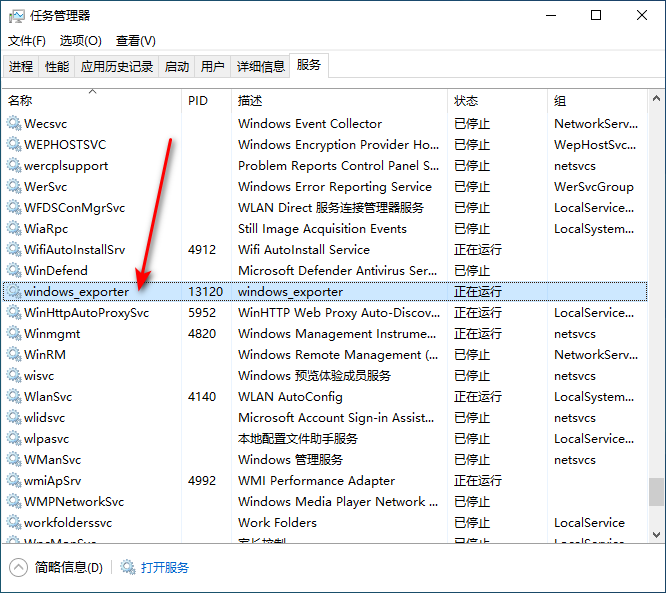
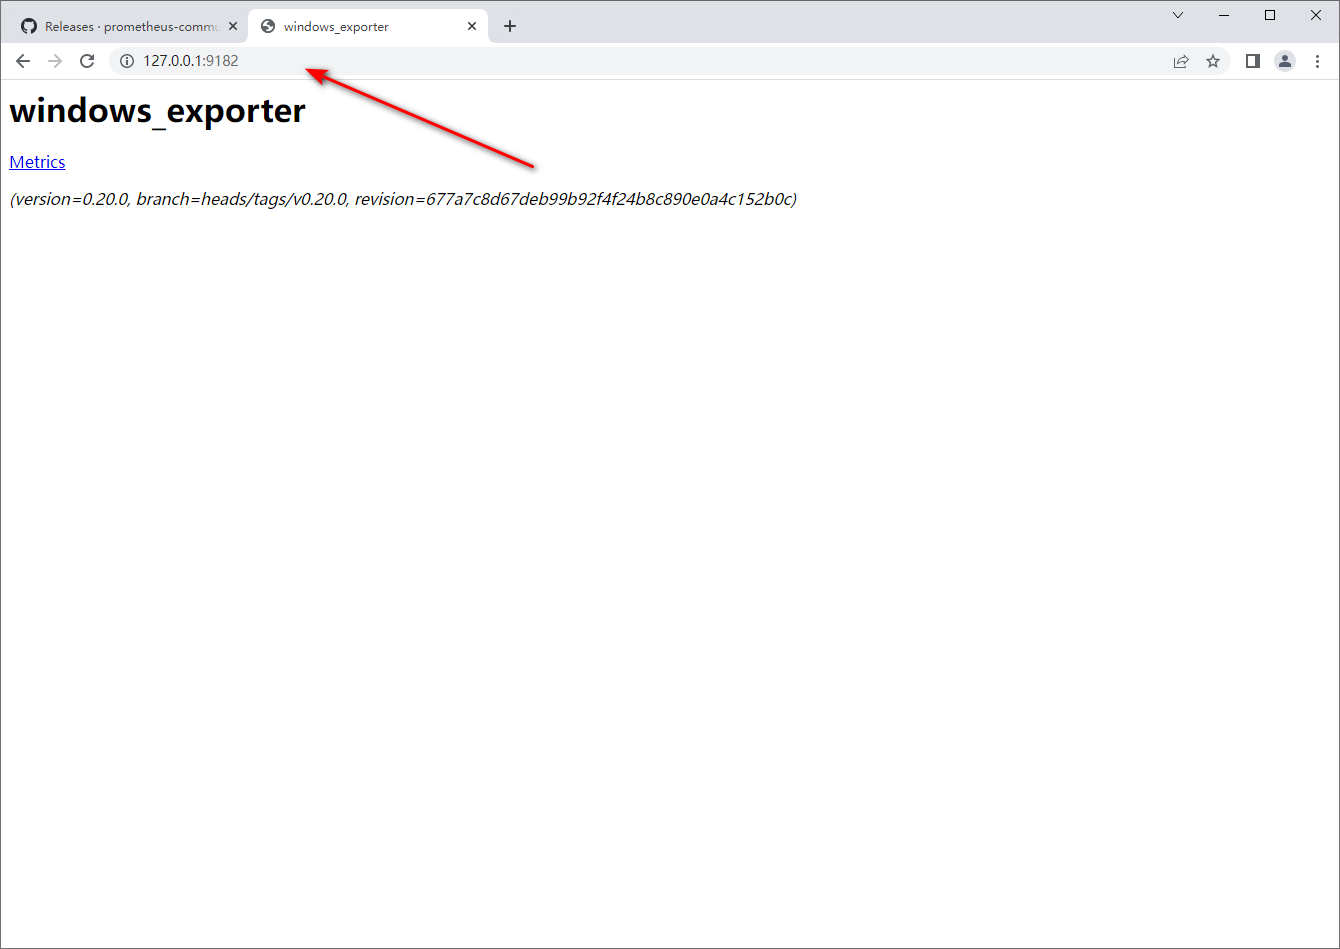
windows_exporter 安装完成之后默认监听地址为 127.0.0.1:9182
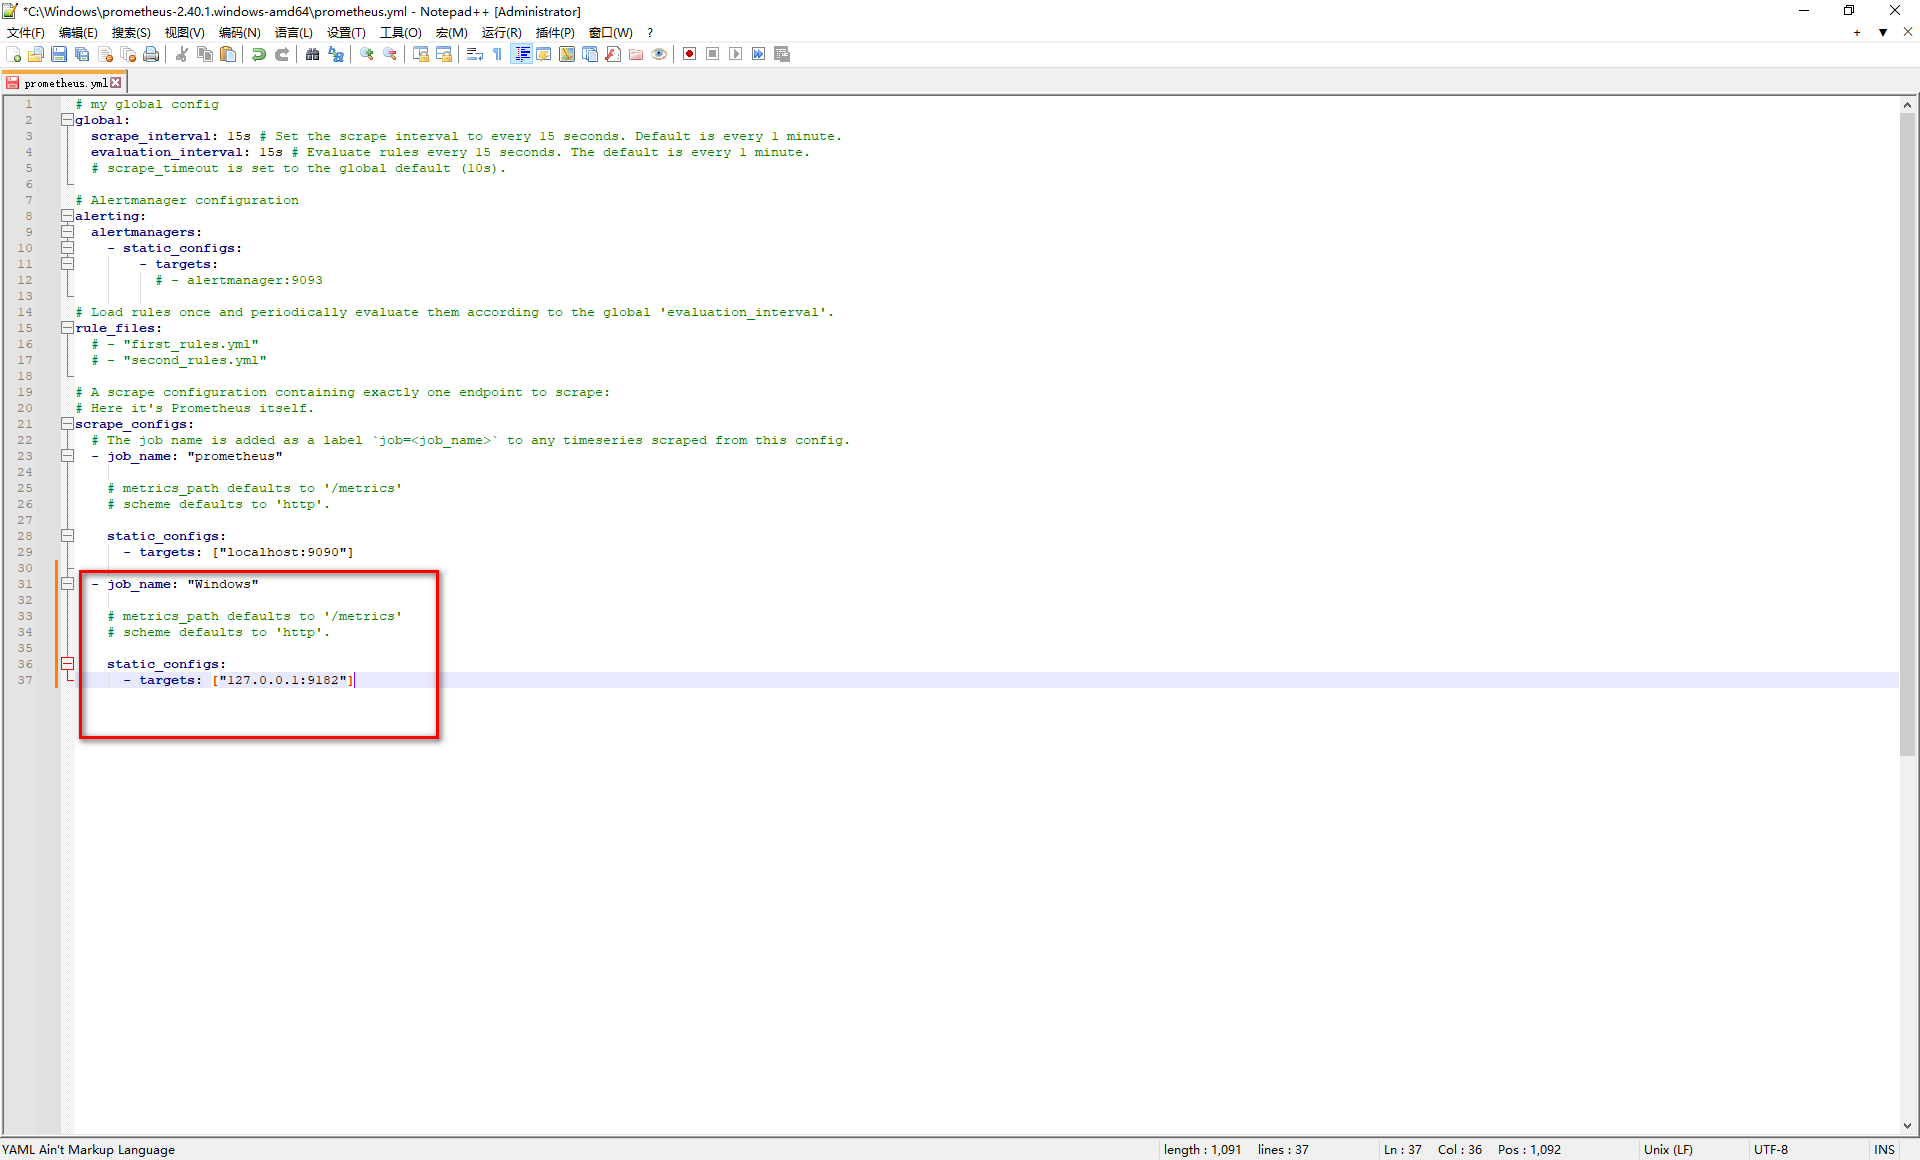
使用普罗米修斯配置 windows_exporter 到 prometheus.yml 配置文件
# my global config
global:
  scrape_interval: 15s # Set the scrape interval to every 15 seconds. Default is every 1 minute.
  evaluation_interval: 15s # Evaluate rules every 15 seconds. The default is every 1 minute.
  # scrape_timeout is set to the global default (10s).

# Alertmanager configuration
alerting:
  alertmanagers:
    - static_configs:
        - targets:
          # - alertmanager:9093

# Load rules once and periodically evaluate them according to the global 'evaluation_interval'.
rule_files:
  # - "first_rules.yml"
  # - "second_rules.yml"

# A scrape configuration containing exactly one endpoint to scrape:
# Here it's Prometheus itself.
scrape_configs:
  # The job name is added as a label `job=<job_name>` to any timeseries scraped from this config.
  - job_name: "prometheus"

    # metrics_path defaults to '/metrics'
    # scheme defaults to 'http'.

    static_configs:
      - targets: ["localhost:9090"]

  - job_name: "Windows"

    # metrics_path defaults to '/metrics'
    # scheme defaults to 'http'.

    static_configs:
      - targets: ["127.0.0.1:9182"]
我用图片标出新增的代码如下
上面全部弄好之后我们自己去任务管理器服务手动重新启动 Prometheus 服务 或者cmd窗口用nssm命令重启 nssm restart Prometheus
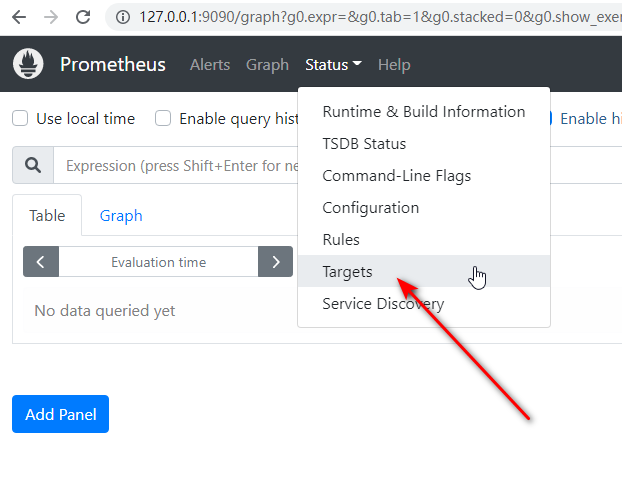
打开普罗米修斯网页界面 127.0.0.1:9090 选择Status下面的Targets
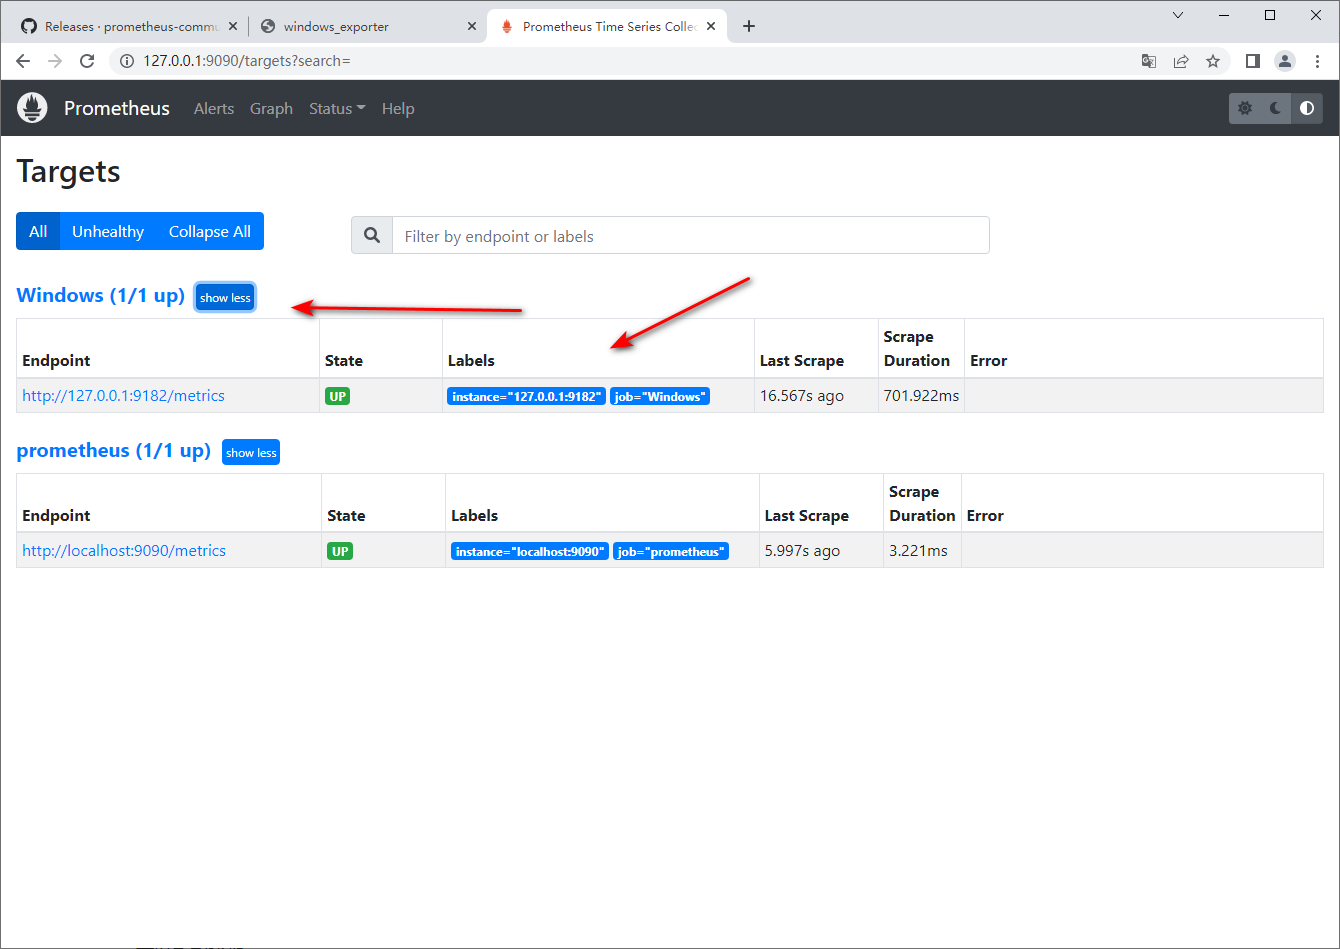
可以看到我们新加的 Windows 块代码
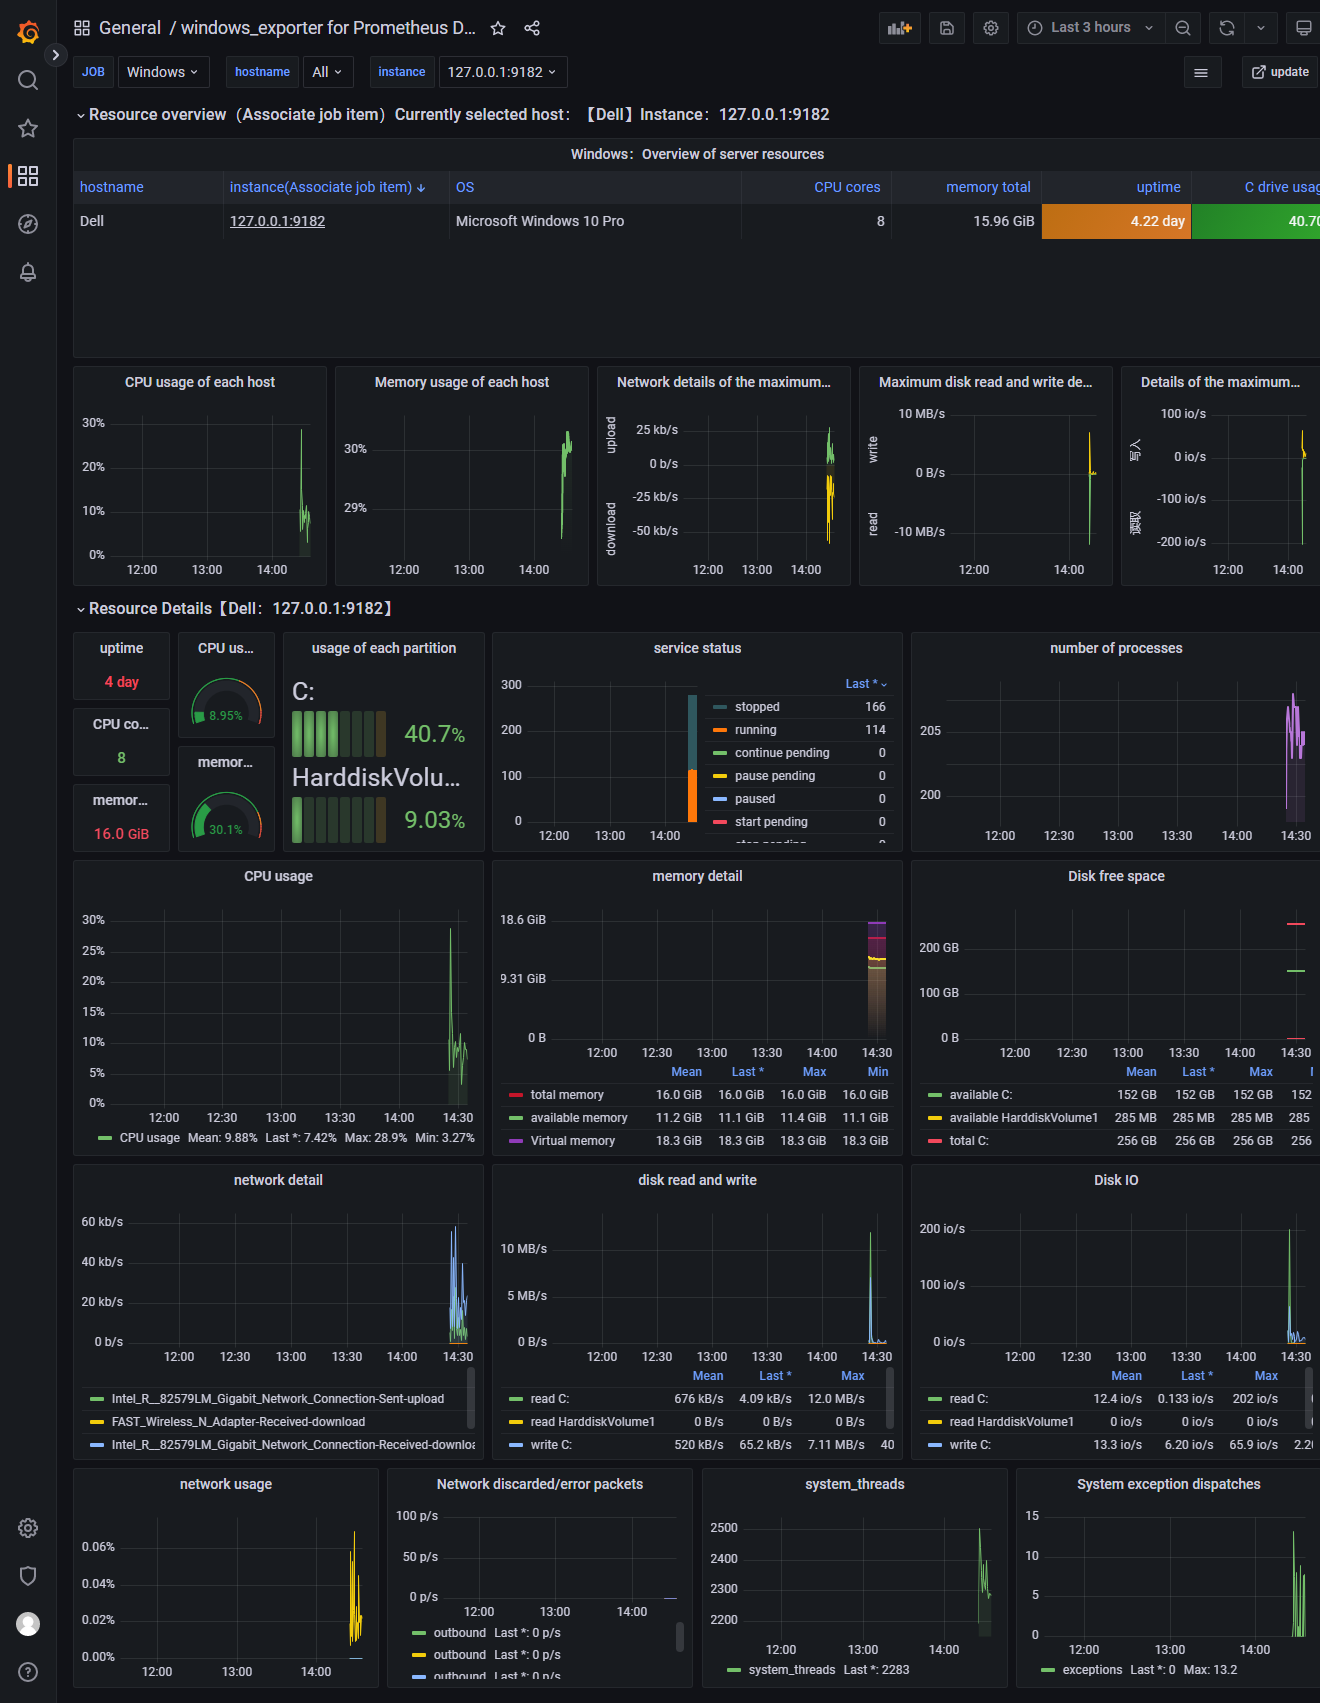
Grafana 可视化展示 windows_exporter 采集的数据
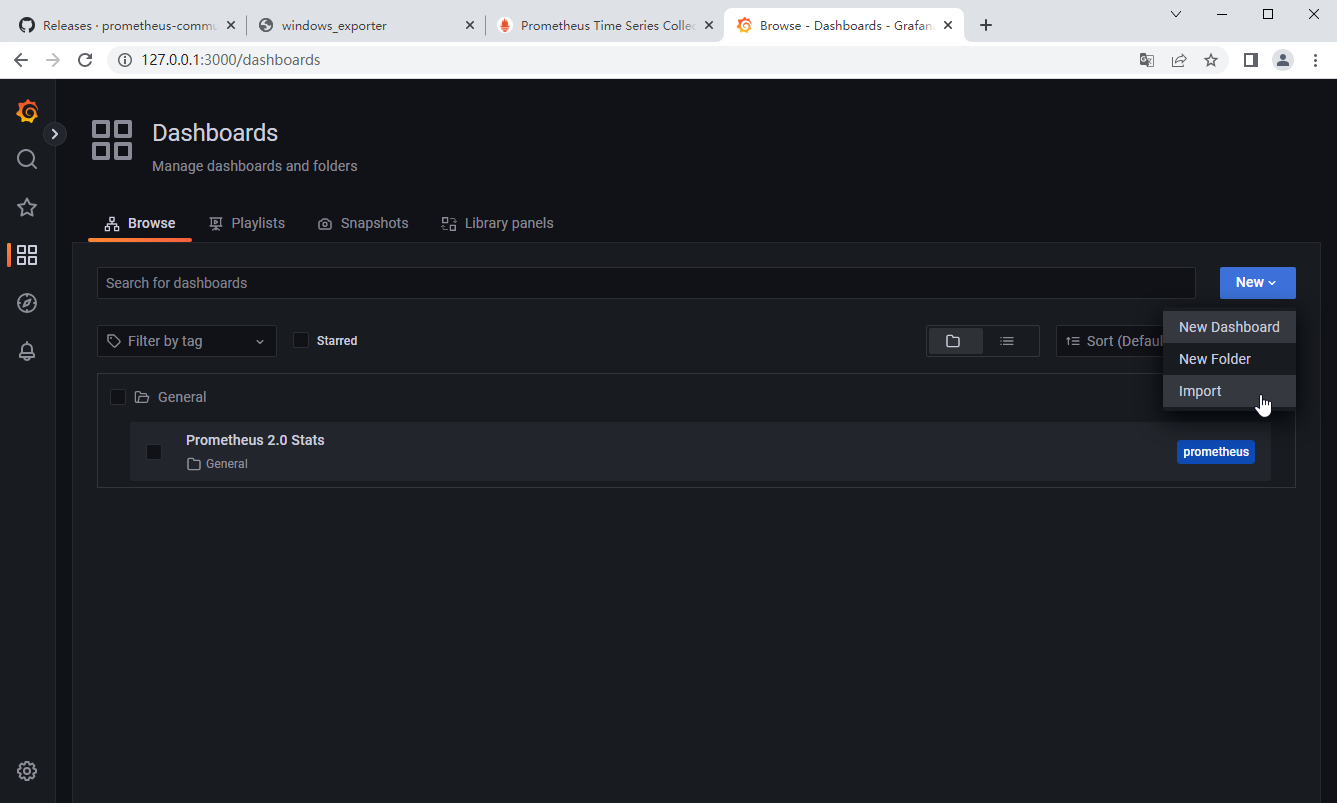
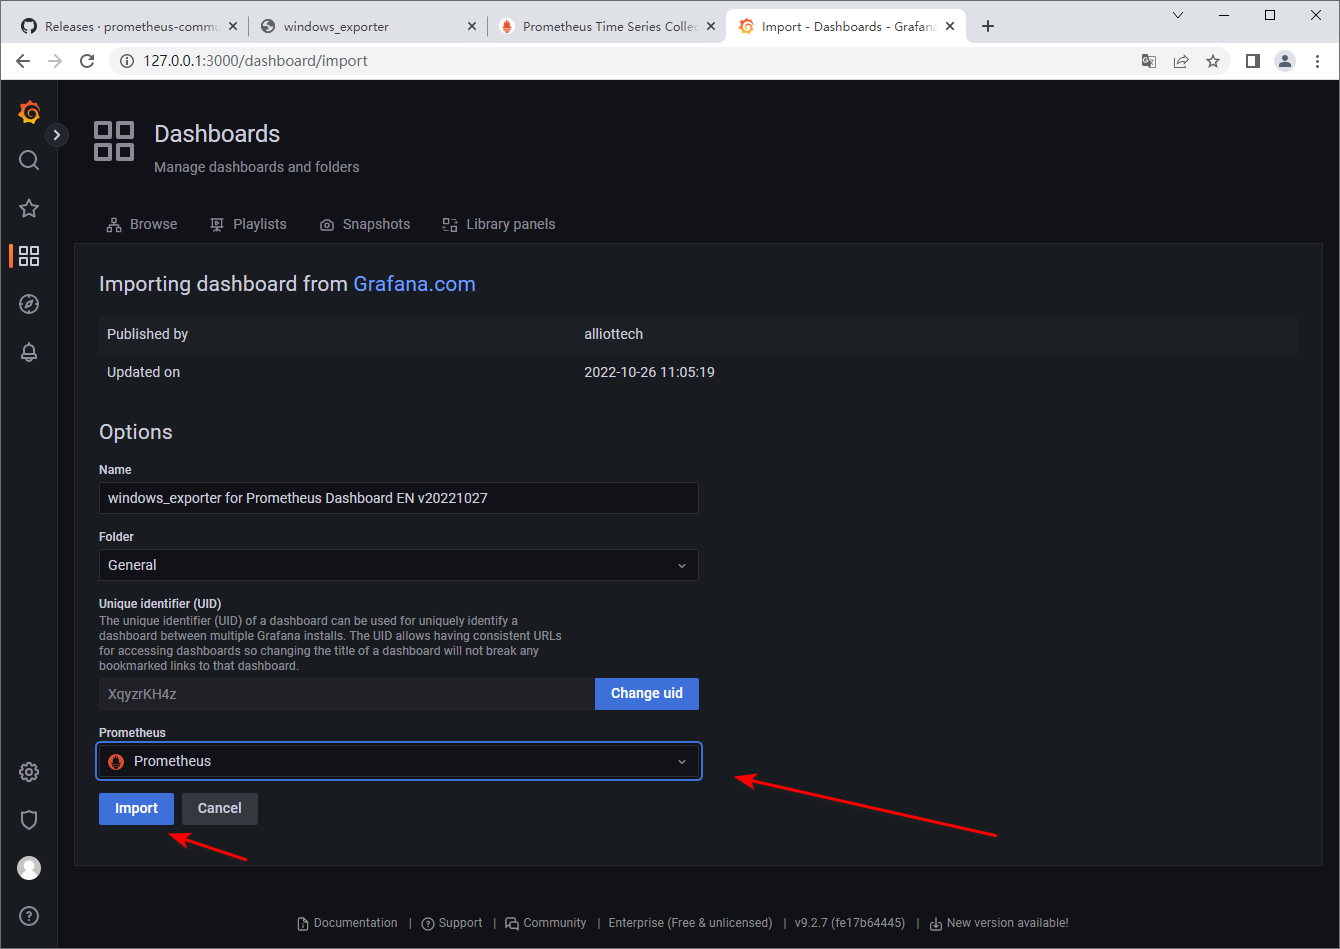
Impot 导入数据 Windows面板号是17264
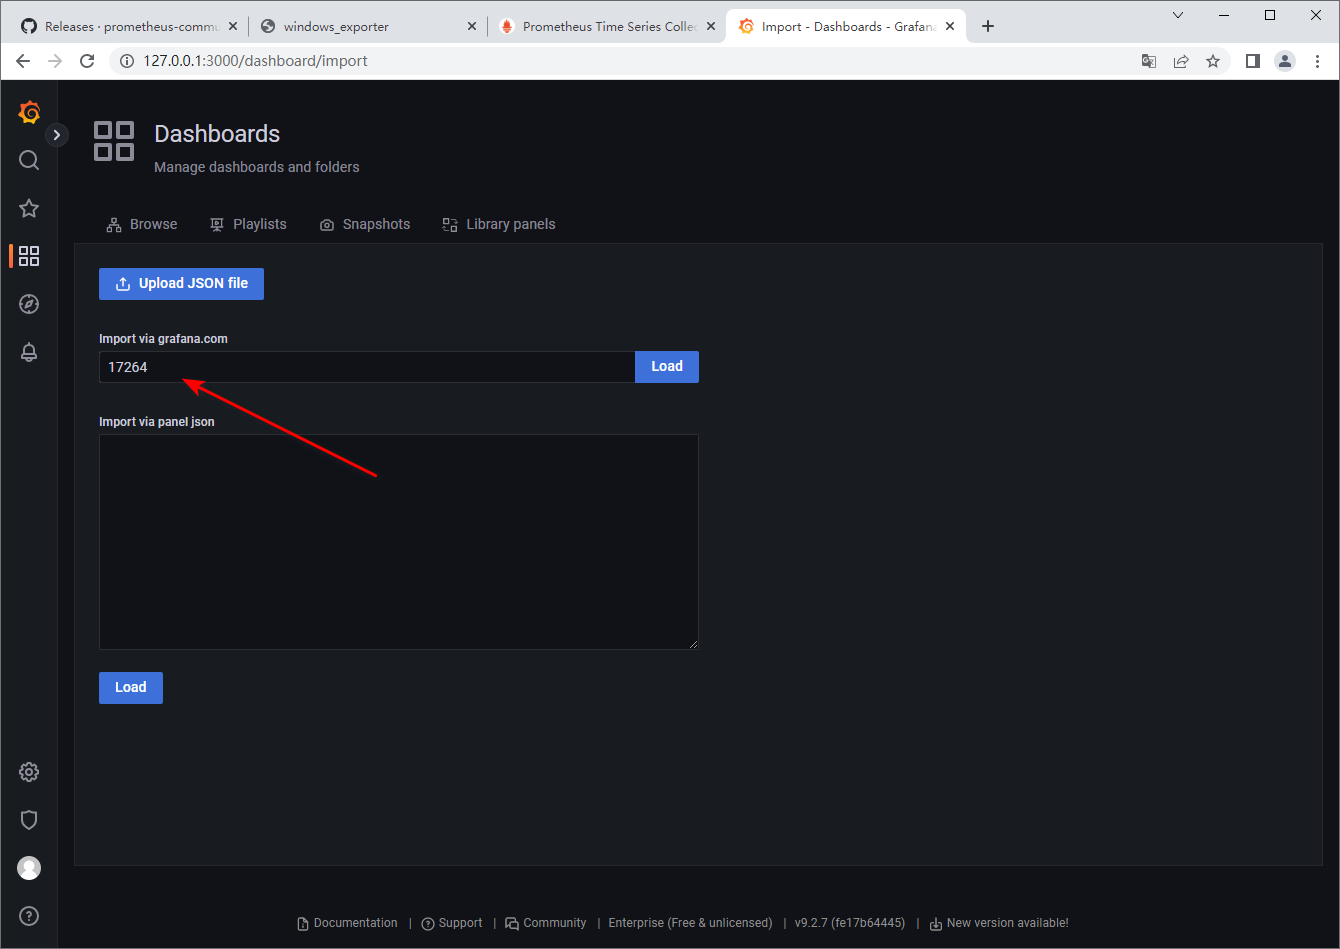
Load 选择Prometheus数据 然后 Import
最终效果如下